Environmental monitoring of groundwater in urban ecosystems.

 Alina Dychko 1*,
Igor Yeremeev 2
1National Technical University of Ukraine "Igor Sikorsky Kyiv Polytechnic Institute" Peremohy Avenue, 37, Kyiv, 03056, Ukraine,
2Taurida National V.I. Vernadsky University, Ivana Kudri Str., 33, Kyiv, Ukraine
Received: 10/10/2017, Accepted: 11/30/2017, Available online: 12/28/2018.
DOI: https://doi.org/10.32557/useful-1-2-2017-0001
HDL: http://hdl.handle.net/20.500.12334/33
*Corresponding author: e-mail: aodi@ukr.net
Under a creative commons license. Volume 1, Issue 2, 2017, pages: 01-10.
Author Keywords: environmental monitoring, groundwater, urboecosystem, measuring matrix.
Abstract.
Monitoring system, that ensures a steady control of water urboecosystem in area of man-caused factors influence, which allows evaluating measures to reduce the impact of hazardous sources on environment, which predicts possible consequences of intensive exploitation of ecosystem objects, is practically absent. Methods for determining structure of measuring network, arising from theory of fractals, are presented.
The developed methodology for improving reliability of data for environmental monitoring is based on determining structure of measuring network, area limits and density of pollution on basis of measuring network data and appropriate interpolation and smoothing algorithms, and also determining dynamics of pollution area.
Measurement network for monitoring of groundwater in urboecosystem should be formed as a matrix structure. The developed system of environmental monitoring allows carrying out constant monitoring of the environment, evaluating measures to reduce the technogenic impact and predicting its consequences.
Introduction
Poluttion of water objects - sources of drinking water supply - due to the inefficient operation of water treatment plants entails deterioration of drinking water quality and poses a serious danger to population health in many regions of Ukraine, causes a high incidence of intestinal infections, hepatitis, increases the risk of carcinogenic and mutagenic factors impact on the human body. Ukraine's retardation behind developed countries for the average life expectancy and high mortality rates are linked at some extent with the consumption of not qualitative drinking water.
Groundwater supplies about 17% of total water consumption and 54% of household water supply in Ukraine. Groundwater resources are less polluted than surface water resources. However, as a result of anthropogenic activities, pollution also occurs in groundwater resources. The most polluted areas are mainly located near large industrial and agricultural sites, as well as settlements. The greatest violations in the natural hydrogeochemical situation are observed in the Dnipropetrivsk and Zaporizhzhya regions with a high level of industry, agriculture development and a large population density [1].
In case of using groundwater as a drinking water source, it is necessary to treat it from compounds of iron, fluorine, manganese, ammonia, and also mineral salts, in particular, salts of hardness. Groundwater with increased hardness is characteristic for the Southern and South-Western regions of the country. Iron-containing groundwater, which may contain manganese, is characteristic for the entire territory of the country. In the Poltava region and adjoining regions, groundwater has increased fluoride content.
Pesticides, nitrogen compounds, nitrates and nitrites reach the ground sources due to contamination with fertilizer residues and sewage of livestock farms.
In general, near 4% of groundwater is considered contaminated in Ukraine, and in the specified regions - up to 20%. Significant groundwater pollution is observed in Donetsk, Luhansk, Dnipro and other industrial regions of the country, as well as in the areas of minerals extraction [1]. For last 30 years the square of flooded areas on the territory of Ukraine has increased almost 9 times and at present moment it is 20% of our country's territory [2].
The current unsatisfactory water ecosystems state shows that problems in the field of groundwater protection from pollution and exhaustion not only have not been resolved, but have also become considerably aggravated, especially in recent years.
Today, practically there are no monitoring systems that would ensure a steady control of the environment in the area of man-caused factors influence, particularly means of transport, would allow to evaluate measures to reduce the impact of these hazardous sources on the environment, would predict possible consequences of intensive exploitation of ecosystem objects, in particular fauna and flora, and in the first place, for people in zone of pollutants sources influence [3]. Therefore, the development of monitoring systems that would fulfill the above tasks is extremely necessary and is the aim of the research.
Areal of pollution determining
The assessment of urboecosystem state includes the construction of a measuring network by presenting it in the form of a Peano curve, which ensures continuous monitoring of the researched system and the absence of jumps between individual points of observation. After determining the structure of the measuring network, the amount of the samples (measurements) is optimized in order to exclude the possible influence of random obstacles.
The block scheme of the fractalization algorithm for determining the areal of pollution is shown in Fig. 1-a, and the general principle of constructing the described fractal structure - in Fig. 1-b. When forming a fractal structure, it is necessary to take into account that there is a rigid dependence of the height of an equal approximating triangle on the length of the segment of approximation L. This forces the length of the initial approximation interval L0 to be chosen such that the amplitudes of the maximum deviations of the real values of the actual distribution F(R) (fi) from the approximating line segment on this segment were compatible with the height of the triangle h10 = (L0 / 3) sin 600 = 0.288 L0.
In order to eliminate this disadvantage, it is proposed to use a modified fractalization algorithm, which involves the creation of a dichotomous fractal structure. The result of fractalization (a model that approximates the "chaotic" process on the segment of approximation) can be written as the fractal value Lm = L0 (2m-1) -1, where m is the number of steps performed during the construction of the fractal structure, as well as a set of 2 m-1 values of coordinates of fractals.
Measuring network structure
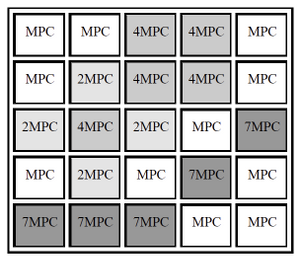
The groundwater system is an object with distributed parameters, so the measurement network of such a monitoring system should be formed as a matrix structure [4]. Each node of the matrix should contain a content indicator and concentration of pollutants in the soil (e.g. dioxin concentration) and groundwater quality indicator (for example, toxicant concentration). Such monitoring system allows to instantly reflect the actual state of soil pollution in zone of technogenic object or transport influence. In case of direct exposure of pollutants to soil and to groundwater, concentration of pollutants significantly exceeds the maximum permissible concentrations (MPC).
In order to detect hazardous discharges and emissions to the environment, to react quickly and to prevent further violations of environmental standards, information about such exceeding or zones in which the pollutant’s concentration is reached MPC or is equal to several or dozens of MPC is required. In this case, the monitoring system monitor should not display the absolute value of the pollutant, but the signal, aliquot to the MPC. At the same time the database system of the system must enter the absolute values of the parameters that are observed.
Then, monitor will cover control zones of each detector, indicating the relative (relative to MPC) pollutant concentration (Fig. 2).
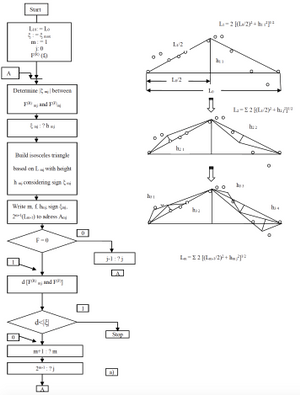
Fig. 1. Block scheme of the fractalization algorithm (a) and illustration of the general principle of developing the dichotomous fractal structure of the pollution area (b).
In order to estimate necessary amount of detectors for reliable control of environment there is a method, based on analysis for relation of probability of registration of the anomaly P(n) and the value of the control system N(n). This relation F(n) has a maximum that measures the optimal amount of detectors. Usually, the cost of a data center Nc insignificantly depends on the amount of detectors and can be taken as a constant.
Similarly, the cost of one detector Nd does not depend on the amount of detectors in the system.
Herewith
N(n) = Nc + nNd , (1)
F(n) = Р(n)/N(n) = Nc-1Р(n)(1 + Nd Nc-1n)-1 (2)
In case of zeroing the derivative F(n) by n, we can obtain the expression for the optimal number of detectors n0:
Nd Nc-1 = [(1 – p) n0 -1][(1 – p) n0 l n(1 – p)]-1 – n0 , (3)
Р(n) = 1 – (1 – р) n, (4)
where: p = SB/S0 - probability of detecting an anomaly by one of detectors when contamination distributes over the SB area, S0 – area, where reliable control of contamination is provided.
Usually, the value of P(n) is determined, then value of n is determined approximately, and finally, ratio Nd/Nc is found while n = n0.
If the anomalous situation in the technogenic landscape is extended sufficiently and the anomalous centre covers the whole region S0, there is a problem of assessing the representativeness of data on the region S0 pollution according to data from n detectors, which is finally determined as ratio of area S covered by means of control to area S0. The expression for R, which replaces P(n), can be represented as:
R = 1 – exp(-S1 n S-10), (5)
where: S1 – area controlled by one detector.
Using the value R instead of P(n), we get another expression to determine the optimal number of detectors:
Nc/Nn = p-1k [exp (pkn0) - 1] – n0, (6)
where: pk = Sk/S0 is relative size of area to which the data can be distributed from one detector.
3. Groundwater environmental monitoring
Pollutants of environment reach to the surface and while filtrating through the layers of soil can fall into aquifer and pollute the groundwater. In order to control the state of groundwater, it is necessary to locate wells in nodes of measuring matrix in which indicators of water quality are installed.
As general direction of groundwater under the body of urban ecosystem is known in advance, in site of the matrix, oriented to flows of groundwater entering (Fig. 3), an appropriate water quality detector is established – in order to detect "background" groundwater contamination before it is directly admitted the body of the technogenic landscape.
At the same time, coordinates of wells are established, which should be used as indicators of groundwater contamination due to migration of filtrate into them. These wells should be positioned so that contaminated groundwater with filtrate would not pass them.
Comparison of the samples taken in these wells with the samples of the "background" well will provide information about presence or absence of filtrate content in groundwater, and about the factual values of pollution and the actual direction of contaminated waters movement.
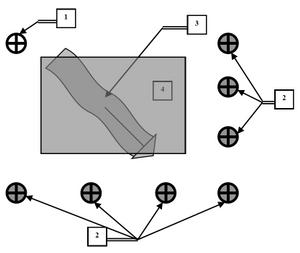
Fig. 3. Oriented location of "background" wells (1) and indicator wells (2); 3 - the general direction of groundwater movement; (4) - the territory of the technogenic landscape.
The next step of environmental monitoring is application of the methods of hybrid monitoring of state of groundwater in urboecosystem, which consists in choosing from a plurality of relevant models the one which Euclidean distance is the smallest relative to the real measurement data executed at the time specified by the model.
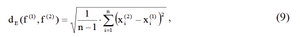
If we consider the metrics that characterize the distance between the curve of the point distribution during real measurement (fr) and the curves obtained by modeling with the help of the model mj (fmj), then the increment of information characterizing the degree of closeness f(r) and f(mj) is the following:

where: N – amount of points in which the measurements were made, x(r)і and x(m)і – respectively the value actually determined by measurement and calculated using the model of amount of pollution at the i-th point.
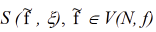
At the same time, the smallest of the calculated metrics will correspond to the model that describes better the process of pollution migration, that is, a model satisfying the following equation:

This stage is completed by defining the number and nomenclature and the absolute values of pollution that were not previously observed in this area, the boundaries of critical pollution, the development of the equidistant contamination and the formation of the corresponding (source) file from the facts bank.
The next stage of monitoring is the establishment of correlations between concomitant and mediocre factors and actual monitoring data, as well as analysis of migration and metabolism of contaminations under specific conditions (taking into account such processes as transfer, gravity deposition, dissolution, deflation, chemical and biological processes, radioactive decay, etc.).
The metric calculation describes the distance of the set of data for current and previous measurement cycles as well as the change vector. Detection of the dynamics of contamination ensures an early change in the methodology for determination of pollutants and replacement of measuring equipment, associated with a change in the range of measurements and the possible decrease in sensitivity of the instruments.
The task of identifying the dynamics of pollution field is to analyze the observations and compare their results with each other by evaluating the metric. The discrepancy in case of comparing results of the past ("reference") and current observations is characterized by metrics:
where: n - number of nodes of the measuring network.
The metrics estimates the degree of gain of information about state of groundwater in urboecosystem in the distribution of n elements of the set f(2) observed during the current control procedure in accordance with information on environment state that corresponds to the distribution f(1) that was evaluated during the previous control procedure and was adopted as a standard.
Moreover, if the statistics f(1) is sufficiently well defined, instead of the elements f(1) their mathematical expectations are used. The increase of information determined in the case of replacing f(2) by f(1) can be considered as non-essential, and the distributions themselves are identical only when statistics f(1) absorb f(2) statistics or when data for statistics are absent, but the value of measure does not exceed the double error inherent in method used for analysis of samples.
In the opposite case, this increment characterizes the dynamics state during the period between observations. The incompleteness of the output data, which is the result of the limited possibilities of monitoring of control objects and insufficient information about the factors that influence the processes in the system, indicates that if

corresponds to the x- approximation which is desirable.
In this case, additional information is needed and the necessary x- approximation can be found only under the condition that the intersection of the sets (x) is not empty, that is
where: MIN - operator of multivalued logic corresponding to the logical multiplication operation.
The next stage is analysis of the possible effects of external factors, which are presented in the monitoring data format as concomitant or middling factors. If the deviation from the trend is not significant, and external factors take place and are characterized by significant amplitude, an analysis of reasons for the invariance of the monitoring results is necessary.
The final stage in assessing the state of groundwater in urboecosystem is to test the hypothesis of the monitoring results, the overall assessment of the reliability of data, and formulation of a decision on the accuracy of estimates and forecasts. The application of the Bayesian theorem allows determining, and subsequently clarifying, the probability of validity of the accepted hypothesis of data distribution under conditions of uncertainty that exists during monitoring.
According to this method, probability is calculated taking into account both previously known and new received information. Validation results with a check mark are sent to the relevant file bank with replacing the appropriate output file.
Conclusions
The consistent implementation of the above-mentioned stages of the information evaluation ensures the reliability of data obtained for decision-making in environmental management. The developed system of environmental monitoring of groundwater in urboecosystem allows developing basis of monitoring system with a steady control of state of the environment, evaluating measures to reduce the technogenic impact and predicting its consequences.
References
[1] National reports on the state of the environment in Ukraine. Access mode: http://old.menr.gov.ua/index.php/dopovidi.
[2] O. Voloshkina, J. Bereznitska “Environmental safety of a territory due to the dangerous processes of flooding.” USEFUL online journal, vol. 1, no. 1, pp. 21–33, September 2017. doi: https://doi.org/10.32557/useful-1-1-2017-0003
[3] Yeremeev, I., & Dychko, A. (2016). The problem of uncertainty in monitoring of environment. Information Processing Systems, 6, 45-47.
[4] Dychko, A. Yeremeyev, I., & Guzovsky, M. (2014). Management of complex systems for handling liquid household wastes. Management of Development of Complex Systems, 18, 168-172.

Please cite as: A. Dychko, I. Yeremeev “Environmental monitoring of groundwater in urban ecosystems.” USEFUL online journal, vol. 1, no. 2, pp. 01–10, December 2018. DOI: https://doi.org/10.32557/useful-1-2-2017-0001


Comments